04 September 2025, Mumbai
India’s fast-fashion market has long been dominated by foreign heavyweights like Zara, H&M, and Mango. But the scenario is shifting.
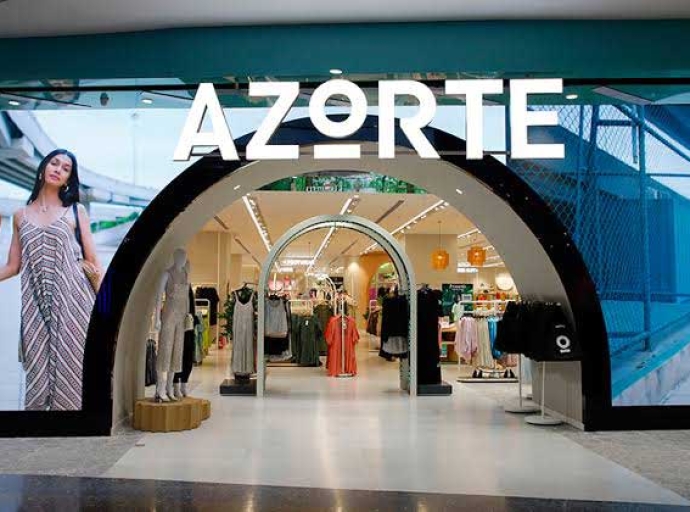
A new homegrown player, Azorte, is quietly but aggressively building its presence as Reliance Retail’s answer to global fashion giants.
Launched in September 2022, Azorte is more than just another store. It is a calculated, technology-infused retail experiment designed to capture India’s young, style-conscious consumer a demographic that demands both global trends and local relatability.
A calculated positioning in a crowded market
Azorte’s entry into the mid-premium fast-fashion space is no accident. This segment that comprises aspirational, urban, and digitally savvy millennials and Gen Z represents one of the fastest-growing consumer groups in Indian retail.
These shoppers want the look and feel of global fashion, but at a price point that doesn’t break the bank.
Fashion Guru
Reliance Retail’s bet is clear: Azorte positions itself as offering fashion-forward apparel at prices 20-30 per cent lower than international fast-fashion rivals.
Its target group spans ages 18-35, largely concentrated in metros like Bengaluru, Mumbai, and Delhi, but increasingly expanding to aspirational Tier-II cities such as Jaipur, Dehradun, and Raipur.
The brand blends Western silhouettes with Indian-inspired elements, offering a mix of apparel, footwear, accessories, and beauty products.
Join our group
With 70 per cent of its inventory designed in-house or co-created, the brand enjoys tighter supply chain control, better margins, and quicker trend adaptation compared to imported lines. Beyond fashion, Azorte markets itself as a tech-fashion brand.
Its stores feature smart trial rooms with digital assistance, self-checkout kiosks, and interactive displays.
Online, it leverages Reliance’s Ajio platform for a seamless omnichannel experience, allowing customers to browse, buy, and return across both physical and digital touchpoints.
Join our community
Balancing both pricing and positioning
Azorte’s pricing strategy is its sharpest weapon. With most products priced between Rs 799 and Rs 2,999, the brand treads the fine line between aspirational and accessible.
Its average order value (AOV), estimated between Rs 3,000-Rs 5,000, indicates that consumers are willing to pay a small premium for the tech-driven shopping experience and curated collections.
This puts Azorte in direct competition with Zara and H&M while also differentiating it from domestic rivals. While Zara & H&M dominate metro malls they are seen as expensive for middle India.
Mango & Vero Moda on the other hand serve a similar mid-premium crowd, though Azorte’s tech-first approach gives it an edge.
And Tata’s Westside & Zudio caters to value-conscious families and mass youth markets. Westside thrives on private labels, while Zudio pushes budget-friendly fashion. Azorte, however, aims for the higher youth fashion experience.
Watch
Table: How Azorte stacks up against the competition
|
Brand
|
Parent company
|
Price range (Rs)
|
Target segment
|
Product strategy
|
Store identity
|
Expansion strategy
|
Differentiator
|
|
Azorte
|
Reliance Retail
|
799 – 2,999
|
18–35, urban millennials & Gen Z (metro + Tier-2)
|
70% in-house & co-created lines, Western + Indo-fusion
|
Tech-first: smart trial rooms, self-checkouts, interactive displays
|
35–40 stores planned across 16 cities, omnichannel via Ajio
|
Tech-driven shopping + localized fashion
|
|
Zara
|
Inditex
|
1,500 – 6,000
|
Urban affluent millennials, metros
|
Fast-fashion imports, limited localization
|
Minimalist, aspirational European feel
|
~23 stores in top metros, limited reach
|
Global trendsetting & brand prestige
|
|
H&M
|
H&M Group
|
999 – 3,999
|
Mass-affluent youth, metros & mini-metros
|
Global lines with occasional India-specific edits
|
Large-format, value-driven
|
55+ stores, strong online presence
|
Aggressive discounting + accessibility
|
|
Mango
|
Major Brands India
|
2,000 – 7,000
|
Premium, fashion-forward women (25–40)
|
Global designs, limited Indian adaptation
|
Boutique-style
|
Select outlets in metros
|
European premium positioning
|
|
Vero Moda
|
Bestseller India
|
1,500 – 5,000
|
Young working women (20–35)
|
Western casuals & workwear
|
Trend-led, functional stores
|
Widespread in malls
|
Affordable chic, mid-premium focus
|
|
Westside
|
Tata Trent
|
799 – 3,499
|
Families & young professionals
|
100% private labels
|
Spacious, department-style
|
200+ stores nationwide
|
Value-for-money private labels
|
|
Zudio
|
Tata Trent
|
299 – 1,499
|
Mass-market youth & families, Tier-2/3
|
Trendy basics, ultra-value
|
Small-format, budget-friendly
|
400+ stores across India
|
Lowest-price fast-fashion
|
DFU Profile
The comparison underscores how Azorte is carefully positioning itself in the ‘white space’ between international giants and domestic value players. While Zara and Mango command aspirational loyalty through their European pedigree, they remain limited in reach and come with higher price tags that exclude middle India.
H&M, with its scale and aggressive pricing, appeals to a wider audience but often faces criticism for generic, less localized collections.
On the domestic side, Westside and Zudio have carved out dominance with their private labels and affordability, but they lack the tech-driven store experience or the trend-driven aura that appeals to Gen Z’s lifestyle aspirations. Azorte’s strategy, therefore, sits at the intersection.
Refer
More affordable than Zara and Mango but aspirational and tech-forward than Westside and Zudio.
Localized and nimble in design, compared to Zara/H&M’s imported playbooks.
Backed by Reliance’s scale, giving it an edge in rapid expansion into Tier-2 and Tier-3 cities where international players struggle.
This hybrid positioning explains why analysts see Azorte not just as another store launch, but as Reliance’s long-term attempt to build India’s first true fast-fashion powerhouse one that can eventually compete with, and perhaps even outscale, global giants on Indian soil.
Visit for more
Expansion drive with Reliance’s muscle at work
From the first flagship store opened in Bengaluru in 2022 to its rapid rollout across multiple cities, Azorte’s growth reflects Reliance Retail’s scale and ambition.
Within two years, it has launched stores in Mumbai, Hyderabad, Jaipur, Udaipur, Raipur, and Dehradun, with plans for 35-40 outlets across 16 cities by 2025.
Reliance Retail CEO (Fashion & Lifestyle) Akhilesh Prasad has projected Azorte could contribute 15-20 per cent of the division’s turnover within three years an aggressive target considering Reliance already runs a sprawling portfolio of brands, from budget mass-market to luxury tie-ups.
Public and industry reactions is divided but curious
Azorte’s debut has sparked both enthusiasm and skepticism. On Instagram and fashion forums consumer’s, reactions are mixed.
Many shoppers praise the store design, digital trial rooms, and the international vibe of the collections. Others complain that product quality does not always justify the pricing, with some dismissing Azorte as ‘Zara-lite’. Several customers also argue that while Reliance promised affordability, certain products are still overpriced compared to Zudio or H&M’s India sale racks.
Retail analysts, however, see promise. A 2024 report by Technopak Advisors says, Azorte’s tech-driven retail identity is a clever differentiator in a market where brand loyalty is fragile. “Azorte is not just competing on product; it is competing on experience,” says Ankur Bisen, Senior Partner at Technopak. “That’s a model well-suited to India’s young urban base.”
Visit for more
Building emotional connect
Azorte’s campaigns extend beyond selling clothes. Its high-profile ‘Your Safe Space’ campaign, fronted by Bollywood’s Khushi Kapoor and Vedang Raina, highlights the brand’s effort to resonate with Gen Z’s emotions.
The campaign acknowledges the contradictions of today’s youth, the desire to party but also stay in, to embrace global fashion but remain eco-conscious. By framing Azorte as a judgment-free zone for self-expression, Reliance is tapping into the values-driven shopping behavior of Gen Z, a segment known to reward authenticity over pure aesthetics.
Can Azorte stay ahead of the curve?
Azorte’s journey is still in its early days. Success will depend on whether Reliance can balance affordability and quality as young consumers are quick to call out gaps in quality or pricing mismatches.
Moreover, smart trial rooms and self-checkouts wow first-time visitors but will need consistent upgrades to stay relevant.
And as international and Indian rivals intensify their omnichannel strategies, Azorte must keep innovating to hold onto its early edge.
India’s fast-fashion market is projected to touch $25–30 billion by 2030, as per a joint McKinsey–BOF 2024 report.
With Reliance Retail’s deep pockets, Azorte is well-positioned to claim a slice of that pie. But the challenge lies in building brand love something international giants have mastered over decades. As one Mumbai-based shopper quipped on Twitter: “Azorte feels like Reliance’s Zara, but whether I keep going back depends on if they get the fashion right, not just the tech.”
LATEST FASHION NEWS